Graphs
In this unit you will learn different graphs:
Stem and Leaf Plot- Stem and leaf plots are a great way to organize data. A picture of a stem and leaf plot is shown below.
Grades on a Science Test
Data: 72, 72, 74, 75, 76, 79, 81, 84, 85, 87, 87, 89, 90, 91, 93, 95, 98, 100, 100
To find a stem, look at your lowest and highest number: 72-100. Since 72 starts with 7 and 100 starts with 10, 7 will be your lowest stem and 10 will be your highest. The stems will be 7, 8, 9, and 10. The last number of each number willgo in a category. The red numbers will go in the 7 category, the yellow in the 8, the blue in the 9, and the green in the 10. If you visit the Measures of Central Tendency category you’ll learn how to do mean, median, mode, and range, which will work for this graph.
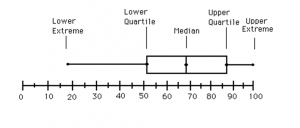
Box and Whisker Plots- Box and Whisker plots are used to compare data. Often used in businesses, Box and Whisker plots tell a reasonable amount for something. A picture of a Box and Whisker plot is shown below.
Scores on a math test
In this plot, your lower extreme is 18%, your lower quartile is 51%, your median is 69%, your upper quartile is 87%, and your upper extreme is 100%. In this case, any number that fell in between the lower quartile and the upper quartile would be considered an average score. To make a box and whisker plot, first find the median of the data. Then, find the lower quartile by finding the median of the data lower than the median. After that, do the same thing to the data above to get your upper quartile. Lastly, the lower and upper extremes are the lowest and highest numbers in the data. Now you know how to make a box and whisker plot.

